It provides the teams with insights such as total submissions, average participation, total blockers, team standup contributors, blockers by people, and more.
This analytics depends on the Working days setting. Under this setting, you have to define your days and holidays for effective insights. Visit Working Days for more information.
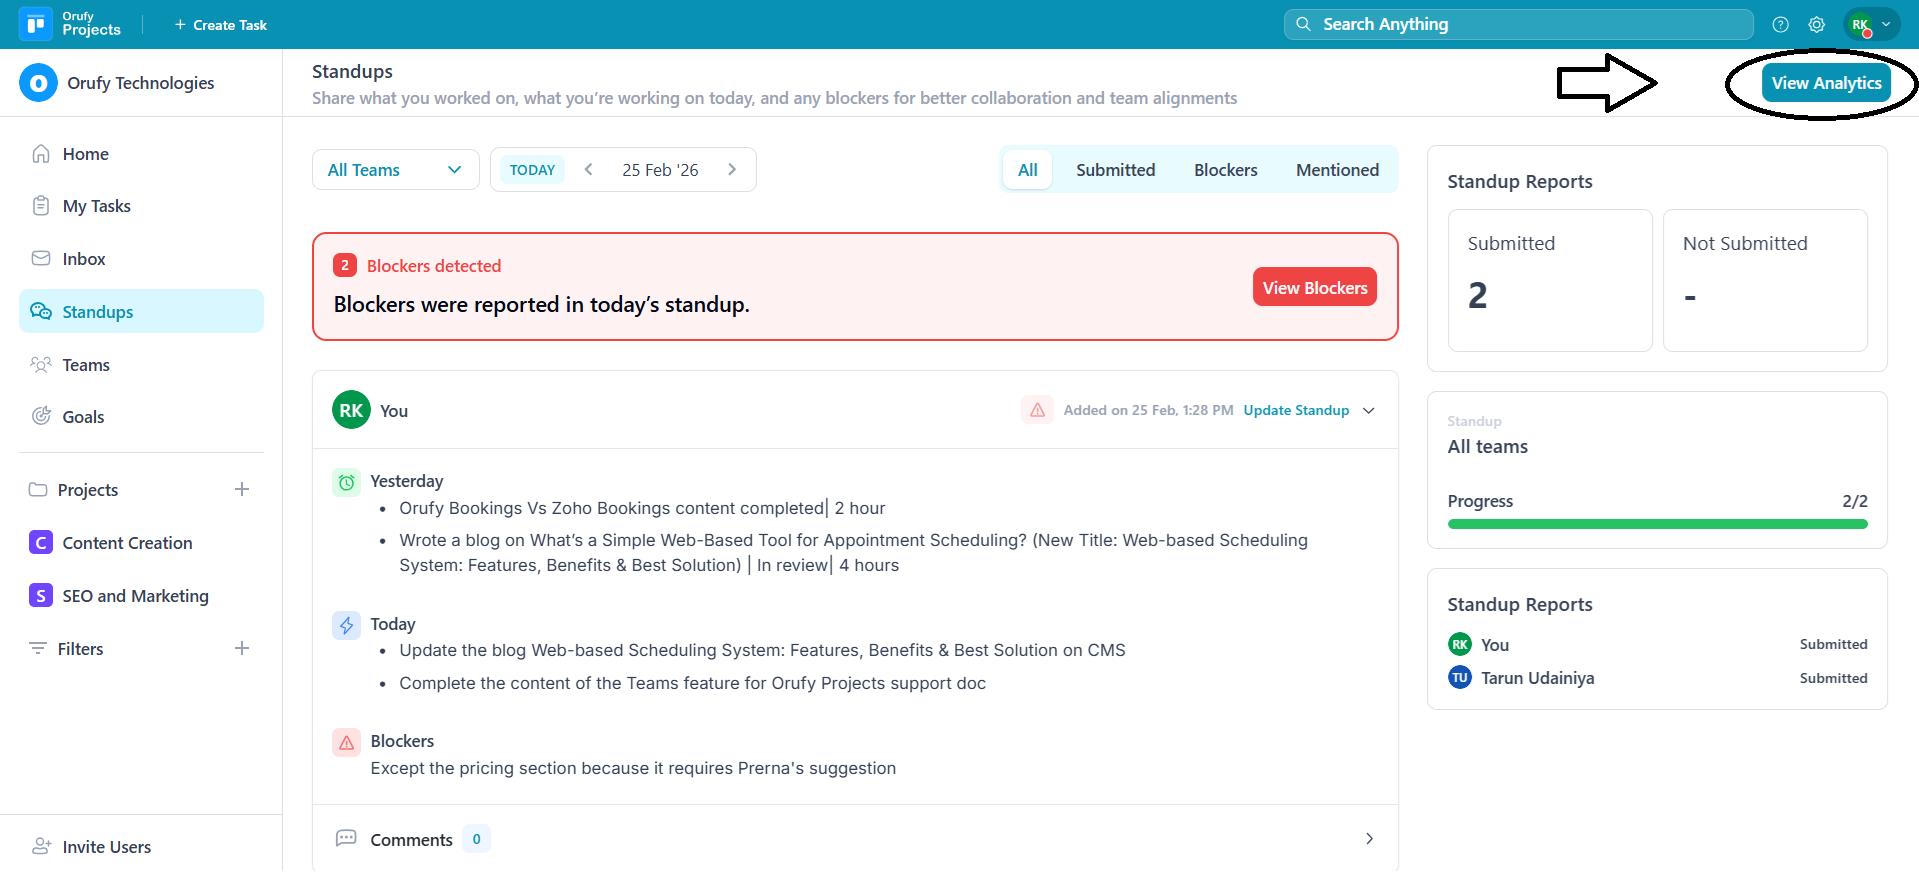
To access the analytics, click on the View analytics button in the top-right corner.
Filters
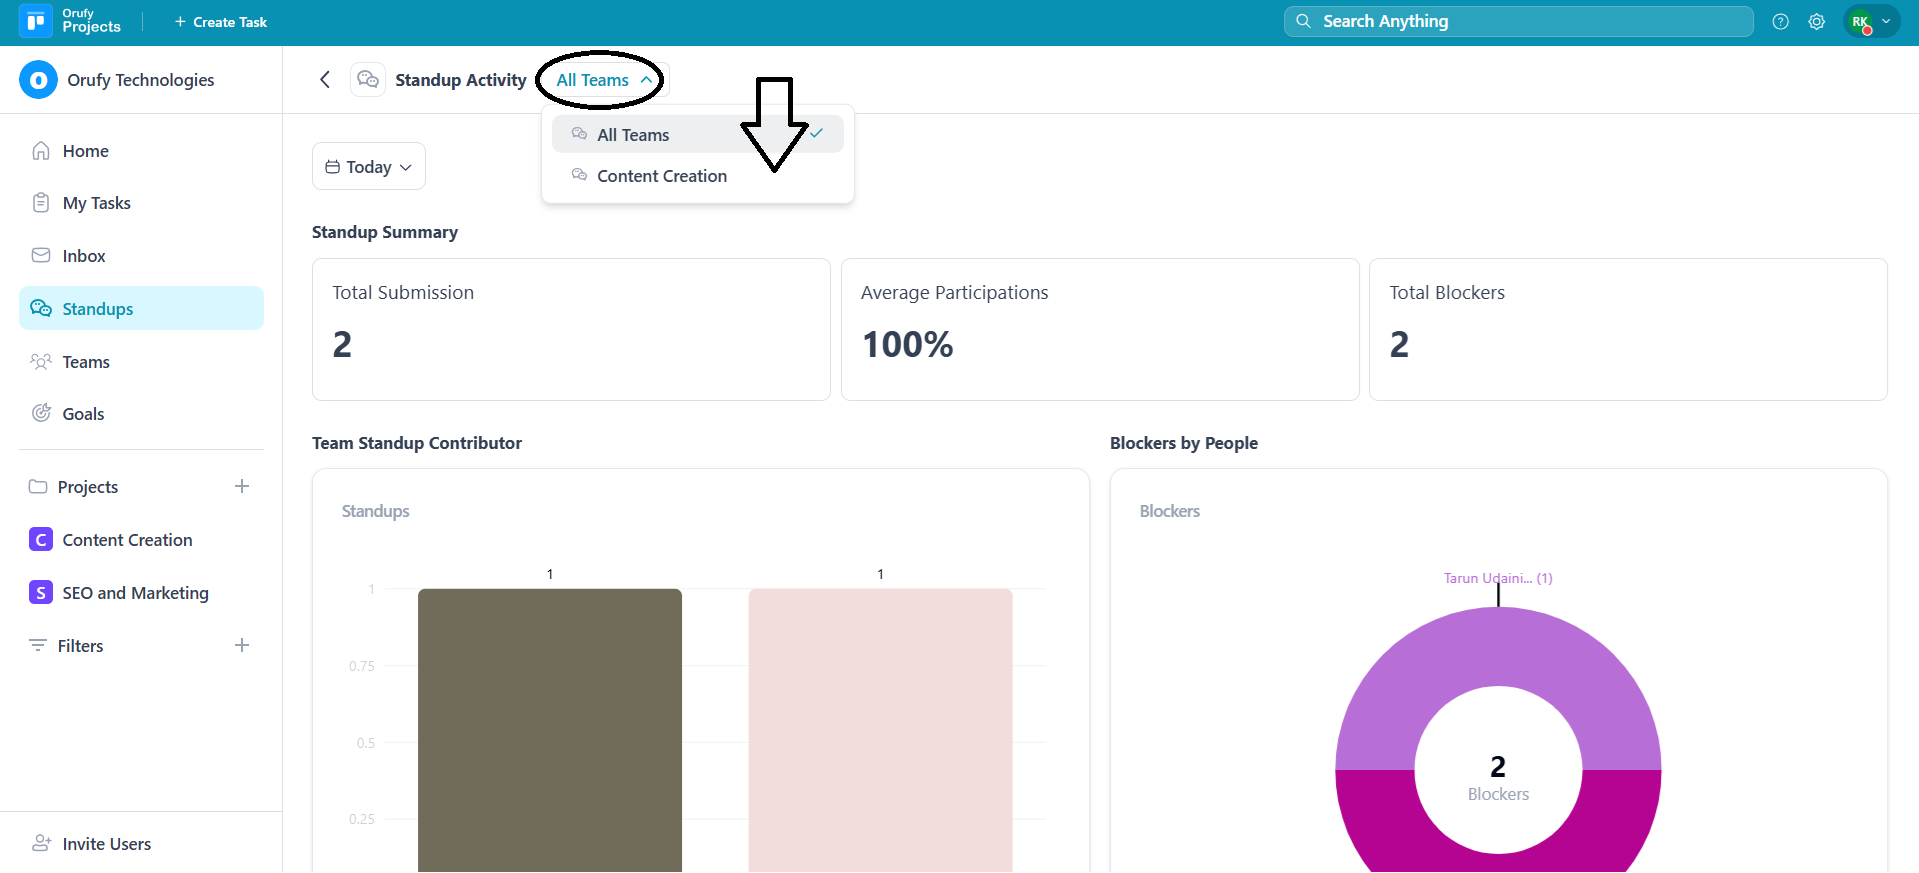
1. Teams You can select from the drop-down which team’s analytics you want to view.
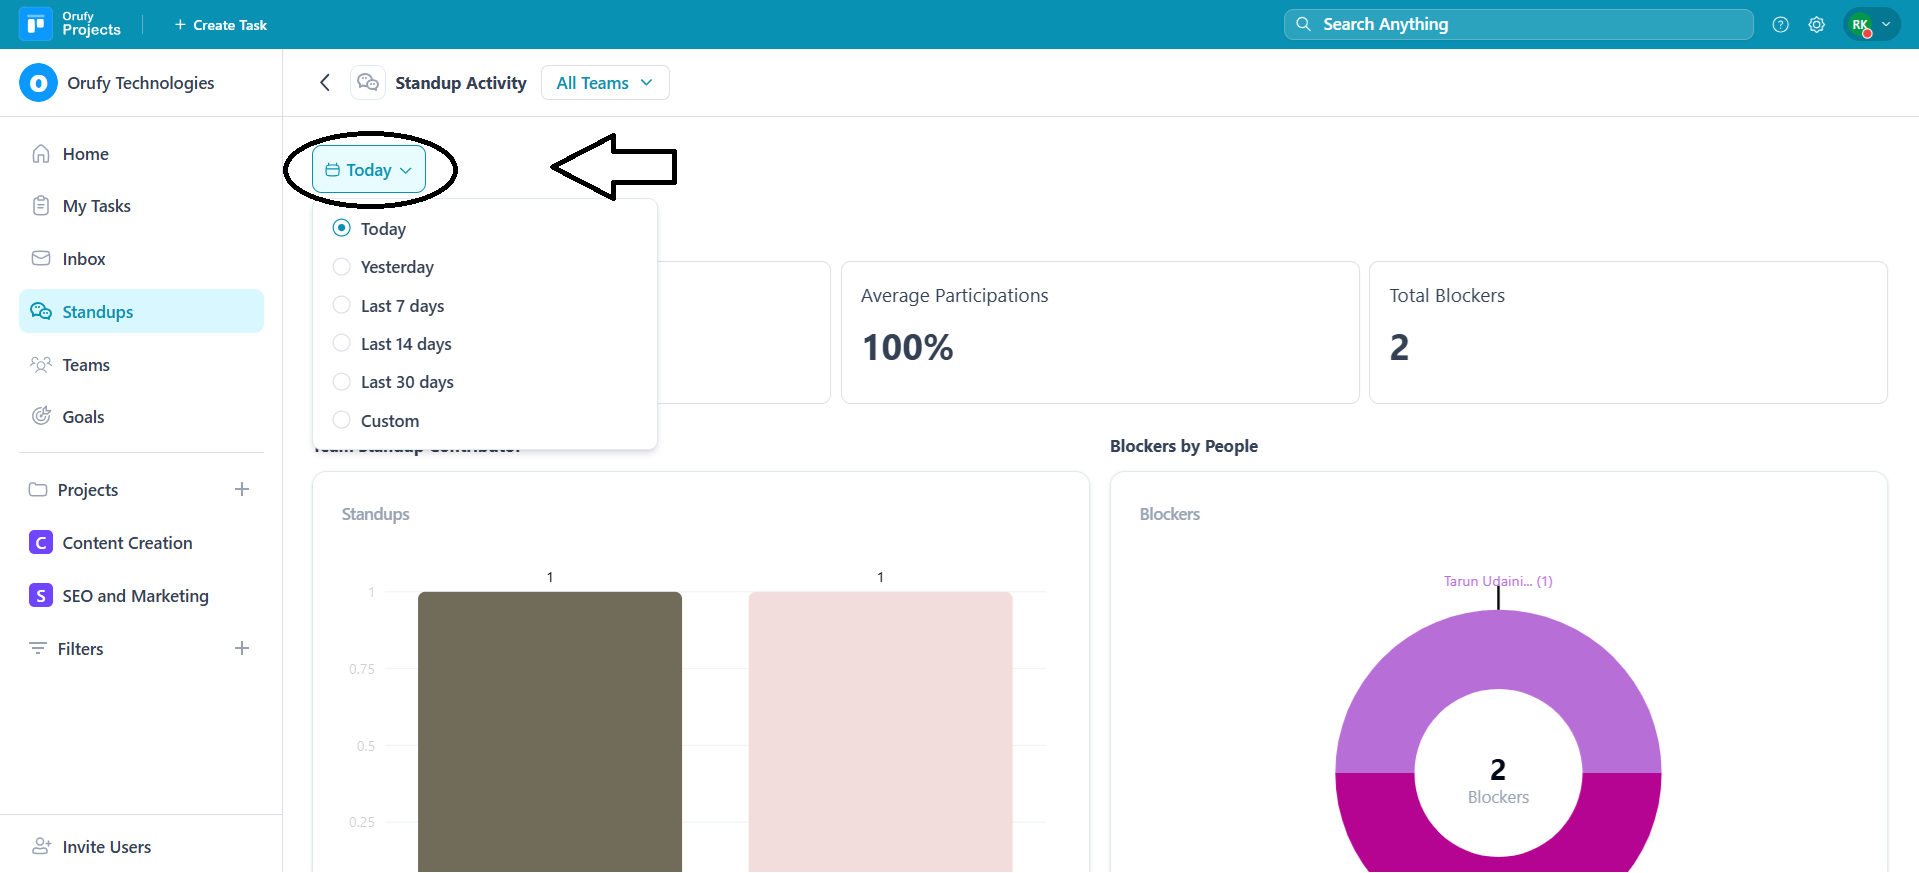
2. Date It allows you to analyze standups for a particular day. You can set the days to today, the last 7 days, or custom as per your requirement.
Stand-up Activity
An overview of the standup activities of a selected team and duration.
1. Standup Summary
It includes three sections:
-
Total Submission It displayed the total number of standups submitted by team members. You can track the team members who shared the daily standups.
-
Average Participation It shows the percentage of team members who have participated in submitting the standup. It measures the overall team’s participation for standup.
-
Total Blockers It shows the total number of blockers reported in the standup. This helps to identify issues that are affecting the tasks.
2. Team Standup contributor It shows a bar graph representation of which team members have contributed to submitting the stand-up.
3. Blockers by People It shows a pictorial representation of team members, indicating blockers in their stand-up.
4. Monthly Standup Participation Trend It shows how many people have participated monthly in a stand-up. This shows consistency and engagement of the team members.
5. Top Standup Contributor It shows a bar graph representing which team members have most frequently submitted the standups.
6. Least Standup Contributor It shows a bar graph representing which team members have submitted the standups the least.


