
Analytics is a detailed view of your booking activity and performance. It tracks how events are created, completed, rescheduled, and cancelled, making easeri to understand the booking patterns.
Date Range: Select the time period from the drop-down menu for which you want to view analytics. All the data and chats on the pages are updated based on the selected time period.
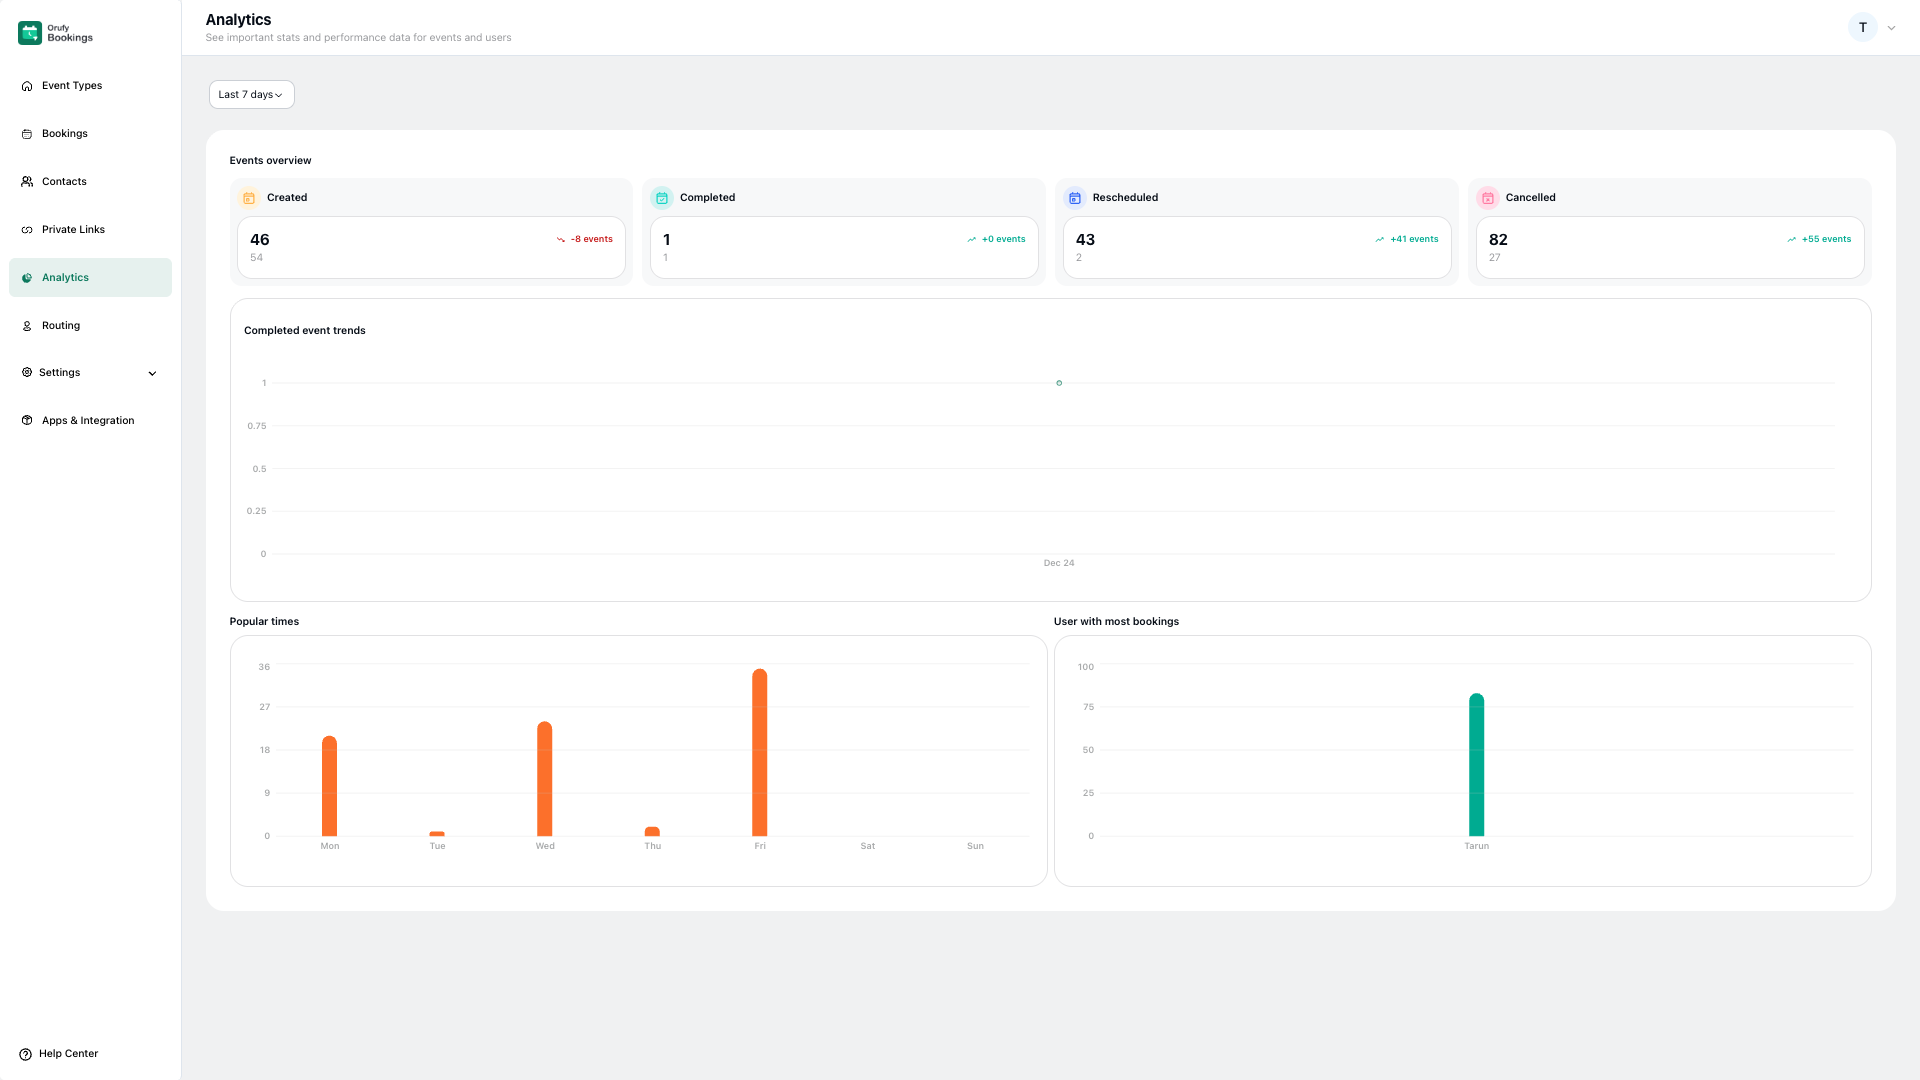
1. Event Overview
This shows the data for your events.
-
Created: It shows the total number of events that were created during the selected time period.
-
Completed: It shows the total number of events that were successfully completed. This helps measure how many bookings actually took place during the selected time period.
-
Rescheduled: It shows the total number of events that were rescheduled during the selected time period. This can indicate scheduling conflicts or availability issues.
-
Cancelled: It shows the total number of events that were cancelled during the selected time period. Completed event trends
2. Completed Event Trends
The completed event trends show each data point represents the number of events completed on a specific date. It helps track overall performance trends.
3. Popular times
The popular times represent the number of bookings per day of the week. It helps track when customers are most likely to book an event during the selected time period.
4. User with most bookings
User with the most bookings reveals the host who has handled the highest number of bookings during the selected time period. It displays the user name with the number of bookings handled.

